
How the Elite Fall?
Can the best carriers in the league stay at the top of the game?

In the 2020-21 season, according to the excellent Oval Insights data, Piers O’Conor had a standout season for Bristol Bears. His Try Equivalents (TEs) total of 30 was the fourth highest that season. One season later it had dropped to 13.5TEs. In the same season Ollie Hassell-Collins had 33.6TEs and the next season that had jumped to 41.2. Which outcome was more likely?
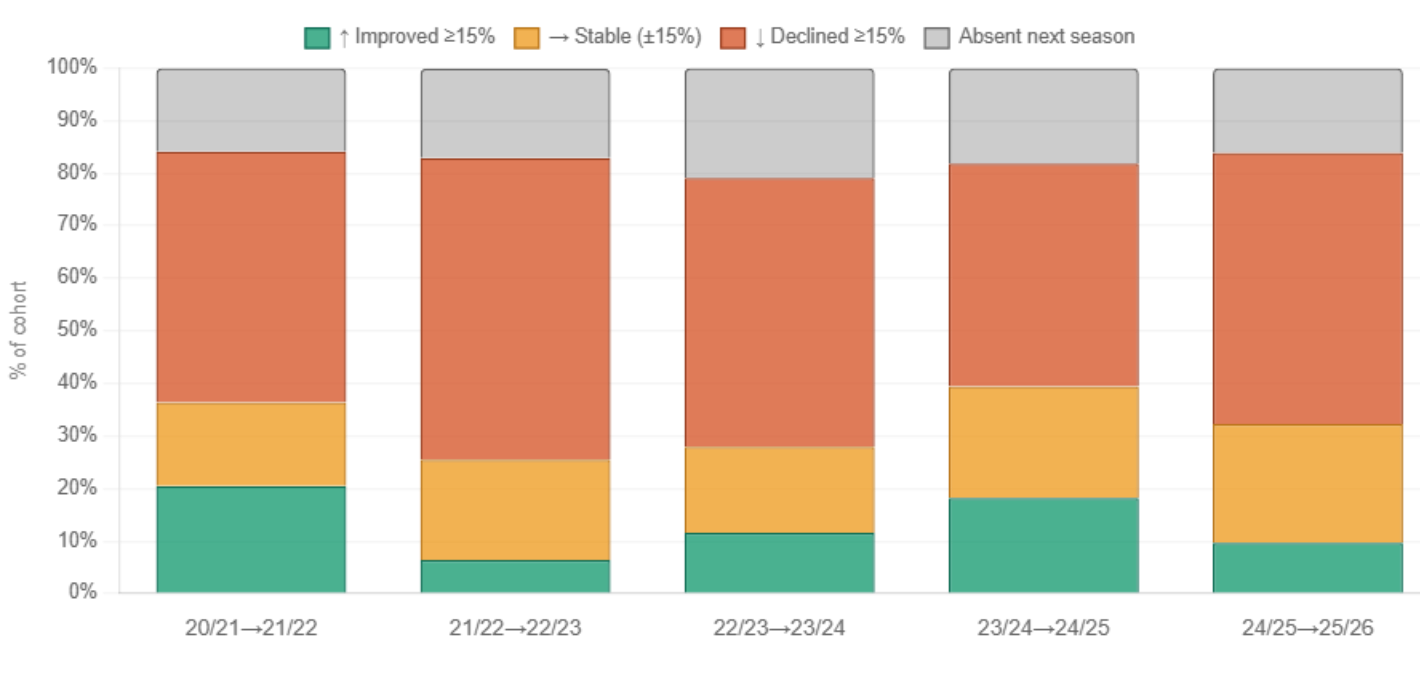
It turns out that if you’re in the top 15% by TEs in any one season, as both O’Conor and Hassell-Collins were, the most likely outcome is a drop of at least 15% the following season. Just 23% of the elites improve by at least 15% with 13% staying stable, 45% declining, and 20% are absent the following year (either through injury or moving to a non-Prem club). Even at its lowest in 2023-24 to 2024-25 a full 52% of elite carriers saw a decline in their production from the season before.
Even if we look at players with at least 10 TEs and see what happens in the following three seasons, 54% have shown an overall decrease in performance. In some ways this is to expected. If you’re one of the best in the league you have less room to improve into. But, it’s worth remembering that we’re not talking about the top three or four players in the league. In 2021-22 this top 15% was 47 players. But, what if you could know who was going to improve the next year?
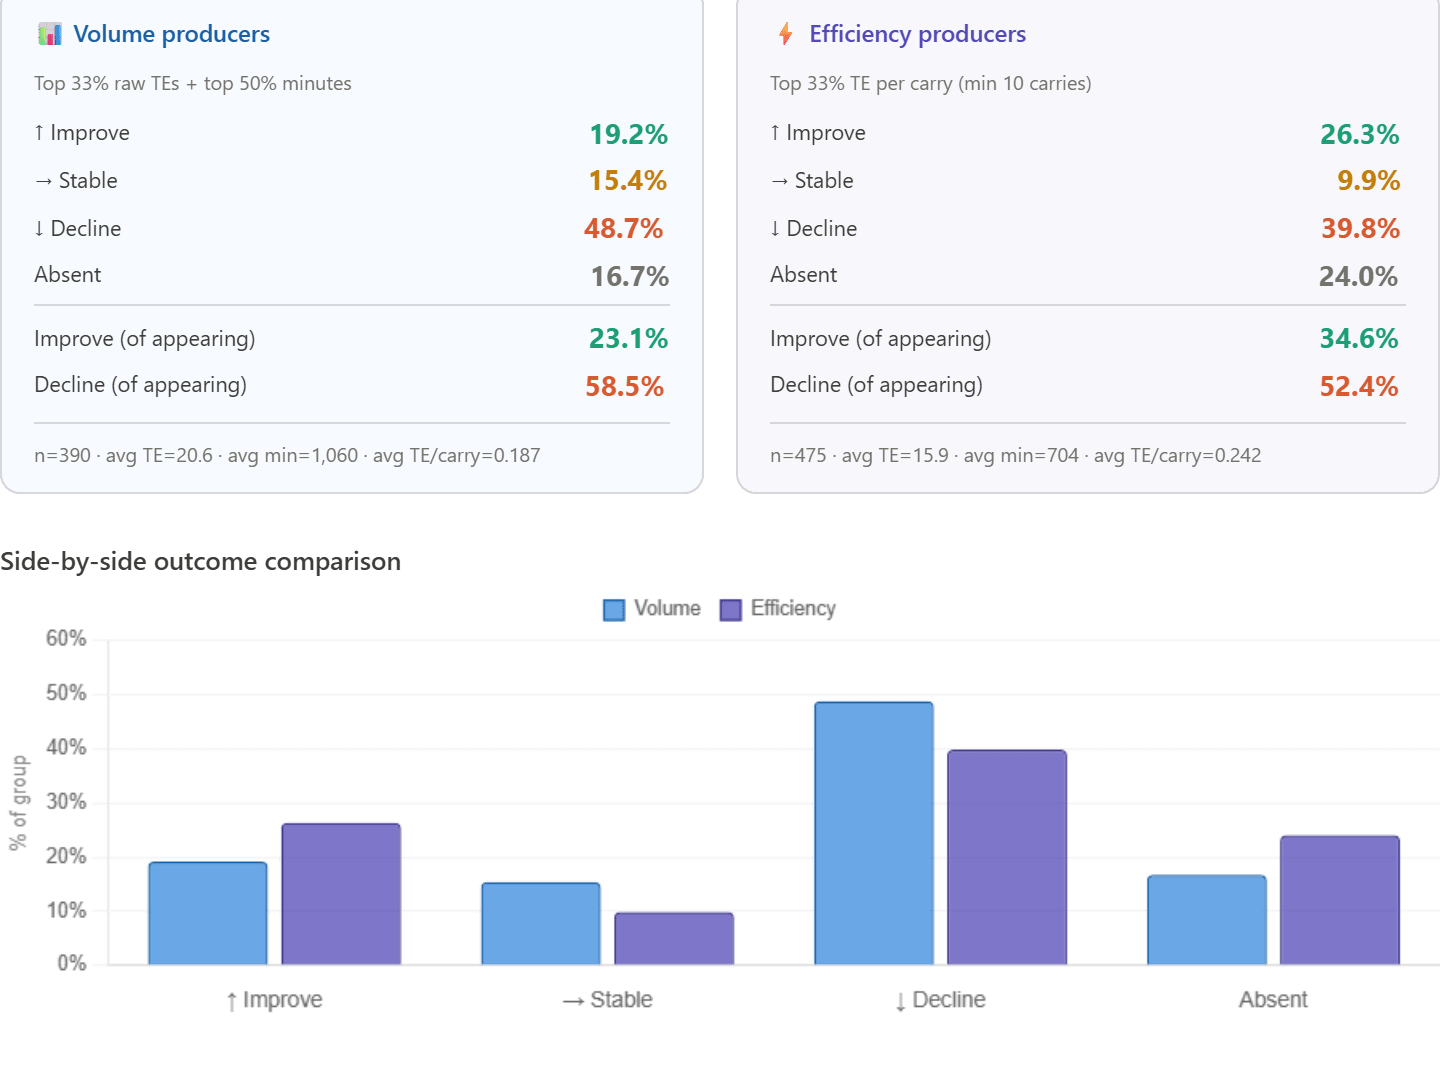
It turns out we can start to do that. And this is where things get fun. We can split our players into two types; Volume and Efficiency players. Our Volume players are in the top 33% by total TEs and the top 50% by minutes played. Our Efficiency players are in the top 33% by TEs per carry with at least 10 carries. The Efficiency players 26.3% of the time versus 19.2% for the Volume players and a similar gap is seen when looking at the number who decline with the Efficiency cohort 9 points lower. All this suggests that the most likely players to improve are those who have done a lot with a small sample size. But is that why they improve or is it because they’re just younger?
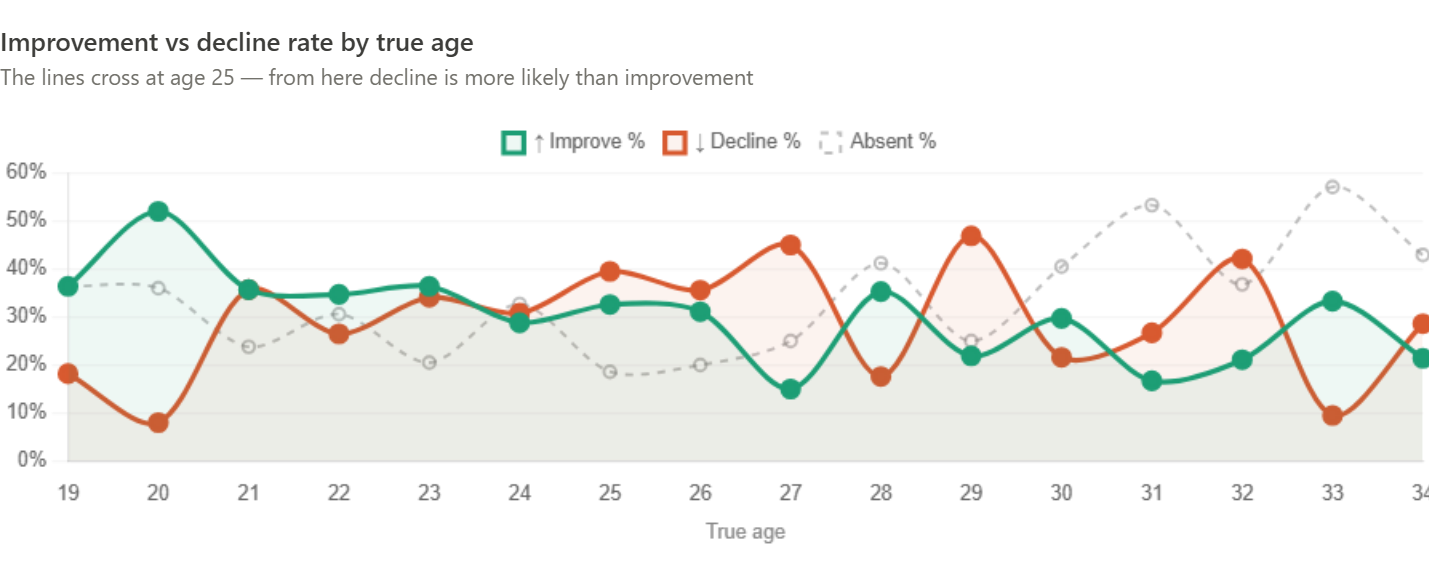
We can do this by looking only at wingers and fullbacks. Remember, we’re looking at whether their output increases or not the following season. The picture is fairly clear with players consistently improving through age 23 before decline takes over. As they reach their late 20s not only is decline more likely but absence also thins the herd with more than 50% of players not featuring the following year after age 31.
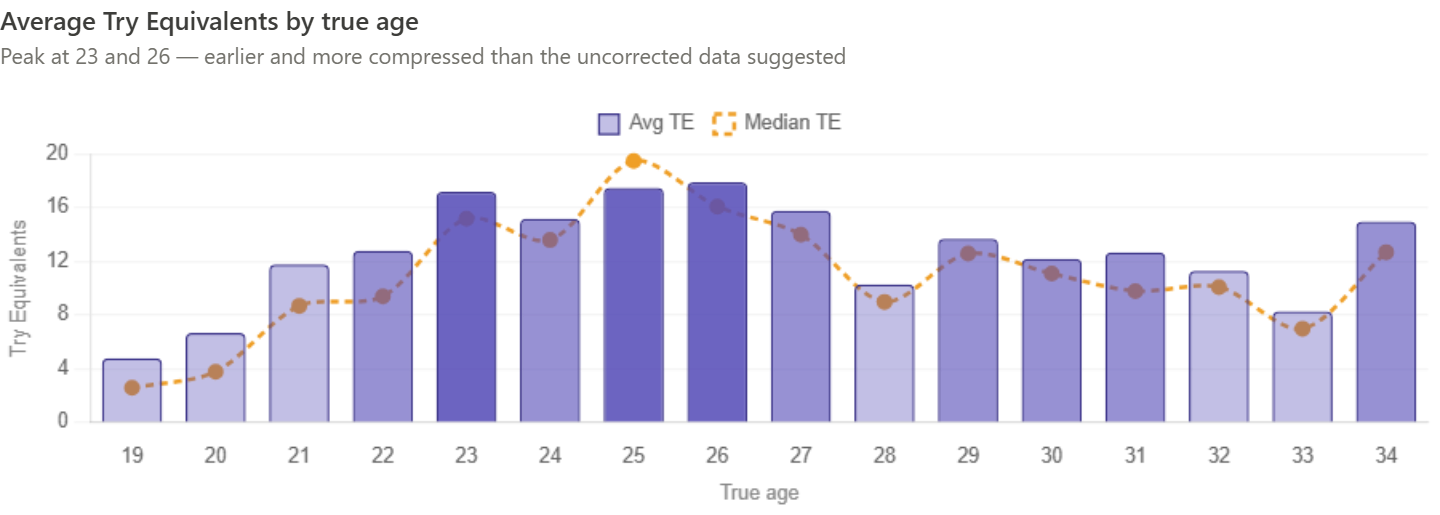
There are two parts to this; improvement and raw results. For example, a player who declines by 16% from 30 TEs is a better value player than someone who improved by 20% from 10 TEs. While our young uns are busy improving, they’re not yet hitting their straps. That happens at 23 and generally sustains until 27. The decline after 30 by TEs is not as stark as we saw in the other graph. The reason for this is that if a player has made it through to 31 they’re likely to be a very good winger even if they’re declining.
What does this tell us? Firstly, a good pick-up is someone young who has shown bursts of talent in a small sample size. After all, they have a greater chance of improving. Secondly, don’t pay someone expecting them to deliver what they did the year before. It’s much more likely that they will decline than stay equal or improve. Even if you’re giving them a three-year contract, it’s still more likely that they will have declined over that time. Thirdly, on that point, it’s a particularly bad idea to pay someone in their late 20s who is coming off the season of their life. Their chances of sustaining that are incredibly slim. But, there’s nothing wrong with picking an older player. While they are more likely to decline, they’ll be declining from a higher level and can usually be acquired more cheaply.
Isn’t that useful to know?