
Points of Order
Why are teams scoring more and more points?

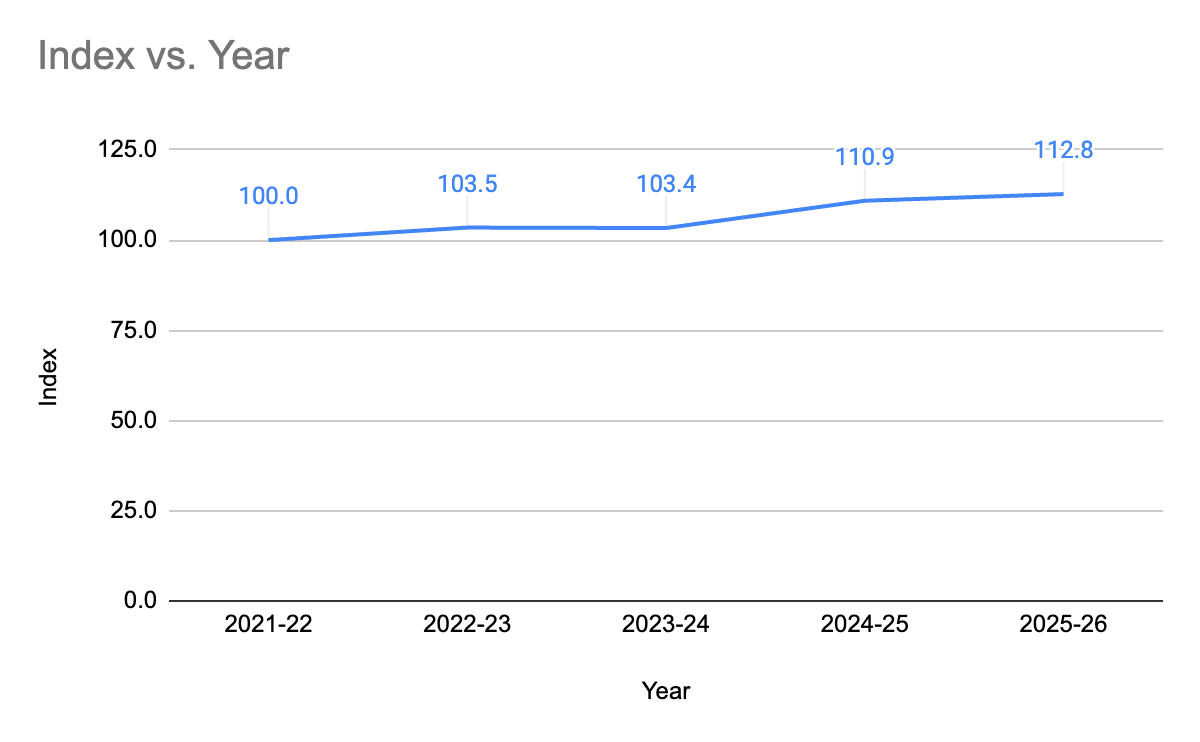
In 2021-22 teams scored on average 23.27pts per match, that has leapt up to 26.24pts this season - an increase of 12.8%. But as you can see below, the last two years have seen a significant increase in points per year. What is causing this? Let’s look at what Oval Insights data says.
Since 2021-22, something weird has been happening. Ball in Play time increased from 33.40mins to 35.26mins in 2023-24. It stayed around that level in 2024-25 and has dropped this year to 33.49mins. That increase to 2023-24 was 5%, so not all that significant and it has since dropped as we’ve said. However, the amount of ‘stuff’ happening in a game has continued to increase. Stuff is the measure of carries + passes + kicks. That has gone from 228.93 per team per 80 minutes in 2021-22 to 280.91 per team per 80 minutes this year - a 23% increase. Where that has been particularly prominent is in the carrying metrics, though kicks and passes have also increased.
That has had an interesting impact on the value of carries. If we exclude Pro D2, then the following metrics have seen the following increases since 2021-22:
Clean Breaks per 80mins: 46% Increase
Defenders Beaten per 80mins: 33% Increase
That has coincided with a decrease in the number of defenders beaten per clean break (DB/CB) from 3 to 2.7 - a 10% reduction. That means that teams are working less hard for the clean breaks which explains why the clean breaks metric has increased at a higher rate than the defenders beaten metric.
There is a comparison here with the women’s game. The women’s game features more carrying than the men’s. However, there aren’t more positive outcomes per carry. For example, there is 50% more carrying and 50% more clean breaks. But that’s not the case here, the positive outcomes from the men’s game are outstripping the increase in carrying frequency - men are carrying a bit more and getting much more from it.
Partly this is due to kicking. The number of contestable kicks has increased by 41% and the number of retained kicks have increased by….ermm…41%. That creates more broken field situations. There are now nine more unstructured carries per match than there were in 2021-22 (an increase of 13%). Previously 7.7% of unstructured possessions ended in a try, that’s now 9.5% and previously +0.9% ended in a positive outcome (positive outcome minus negative outcome) that’s now 3.5%. Teams are increasing the number of broken field situations they face and are now better at converting them into points.
Secondarily to that, there has been an interesting development in 22-entries. Received wisdom would say that the number of 22-entries has increased as teams opt to kick to the corner instead of kicking at goal. That’s not true. In the Premiership in 2021-22 there were 10.91 22-entries per match, it’s now 10.88 and peaked at 11.12 last year. That’s just random movement. What isn’t random movement is what happens once you get there. In 2021-22 a try was scored on 29% of entries and a positive outcome happened on 55% of entries (try or penalty won). This year a try is scored on 35% of entries (a 21% increase) and a positive outcome on 60% (a 9% increase). That has seen a shift in points per 22-entry from 2.4 to 2.7.
Overall, that marginal change has meant there are now 27pts from 22-entries per game compared with 23.24 back in 2021-22 even though the number of points scored from outside the 22 (long range drop goals or penalties) has dropped from 2.38 to 1.8.
Conclusion
I had a discussion this week about whether rugby was becoming a game where teams scrum penalties, kick to the corner, maul penalties, kick to the corner, and score. It didn’t feel like that described the game I have been watching. Thankfully, the data show that isn’t the case either. In the last few years rugby has become a sport where teams look to create more advantageous attacking opportunities in the same way that football has with the advent of xG. That means that an increase in carries has been coupled with a more significant increase in productivity of these carries. That is truly exciting for rugby. This hasn’t come from a change in laws, this has come from coaches changing how they play and it’s given us the best version of the sport I’ve ever seen.
Fascinating breakdown! I'd be curious whether you think that improvement is coming more from pre-loaded set-piece plays (rehearsed strike moves off lineout, phase shapes teams drill repeatedly) or from players becoming better at reading and exploiting defensive structure in real time. The increase in unstructured try conversion would suggest the latter, but I wonder if even "broken field" situations are now being coached more systematically so teams recognise patterns and are prepped with answers rather than purely ad-libbing.